Journées de Phonétique Clinique - Mons
It is an international, interdisciplinary scientific meeting, bringing together experts from various fields, such as phoneticians, speech and language pathologists, doctors and linguists. The aim is to address questions about normal and disordered speech, voice and language, in order to contribute to the knowledge of human communication and to the improvement of diagnostic and treatment methods for speech and language pathologies.
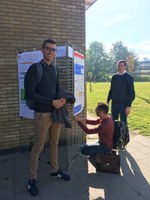
At this conference, I presented a poster about the "speech banana", which is a representation of the consonants on a two-axis graph (frequency x sound pressure level). The idea of plotting such a graph came from the speech banana used in audiometry: a "consonant area" is drawn on the audiogram, allowing the hearing care professional to interpret the hearing curve of the patient with regards to the perception of speech sounds and to adjust the amplified frequencies on the hearing device. The first question that arose was: how was this banana constructed? How was the frequency peak measured that is used to plot the consonants on the graph? After some research, it was evident that there is no clearly defined methodology to be found, except for some recent studies on Thai language. We simply don't know how exactly the banana was built (and yet, it is used on a daily basis!). Following this conclusion, I wanted to find a way to plot a "speech banana" on my own and check if it resembles the "original" one. The main aim here was to provide a graphical representation of a person's articulation of speech sounds. Therefore, I recorded 15 healthy subjects and used LPC coding to identify the spectral peaks for each consonant.
The results show that there is recurrence and stability for some peaks, in some consonants. However, it does not seem relevant to use this method for all of the phonemes. Indeed, fricatives, for example, should not be represented by a sole peak, but rather by a wider prominent frequency band.
Overall, this pilot study is a first step in my search for relevant acoustic cues to measure speech intelligibility. It has to be refined and combined with numerous other acoustic measures (the end product will most likely not resemble a banana anymore...!), in order to allow the assessment of the different speech sounds contributing to a person's intelligibility.
The Journées de Phonétique Clinique in Mons (Belgium) were a great opportunity to share my ideas with experts, and to gather advice and opinions on how to improve this project.
(Also, let's face it: Belgian beer and fries are the best!)

